Visual Expense Analytics
Stop guessing where your money went. Portmoneo transforms raw transaction data into beautiful, interactive insights that help you spend smarter.
Why is Visual Expense Analytics Crucial for Financial Health?
Direct Answer: Visual expense analytics transforms complex data into clear charts. This helps users spot spending patterns, identify savings, and proactively manage budgets. It empowers better financial decisions beyond raw numbers, leading to lasting control.
Raw numbers and endless spreadsheets often lead to financial oversight. Portmoneo’s robust expense analytics engine changes this by turning your everyday transactions into crystal-clear charts and graphs that reveal your financial story. This isn’t just about seeing data; it’s about gaining profound spending insights that empower you to take control.
We’ve observed that users who actively visualize their finances are significantly more likely to achieve their financial goals. Whether your aim is to save for a dream vacation, cut down on discretionary spending, or simply understand every dollar’s journey, visualizing your financial data is the crucial first step. Our intuitive financial visualization tools provide an instant overview, helping you identify patterns, celebrate successes, and pinpoint areas for improvement, transforming abstract figures into tangible knowledge Source: Consumer Financial Protection Bureau.

What Visualization Tools Does Portmoneo Offer for Spending Insights?
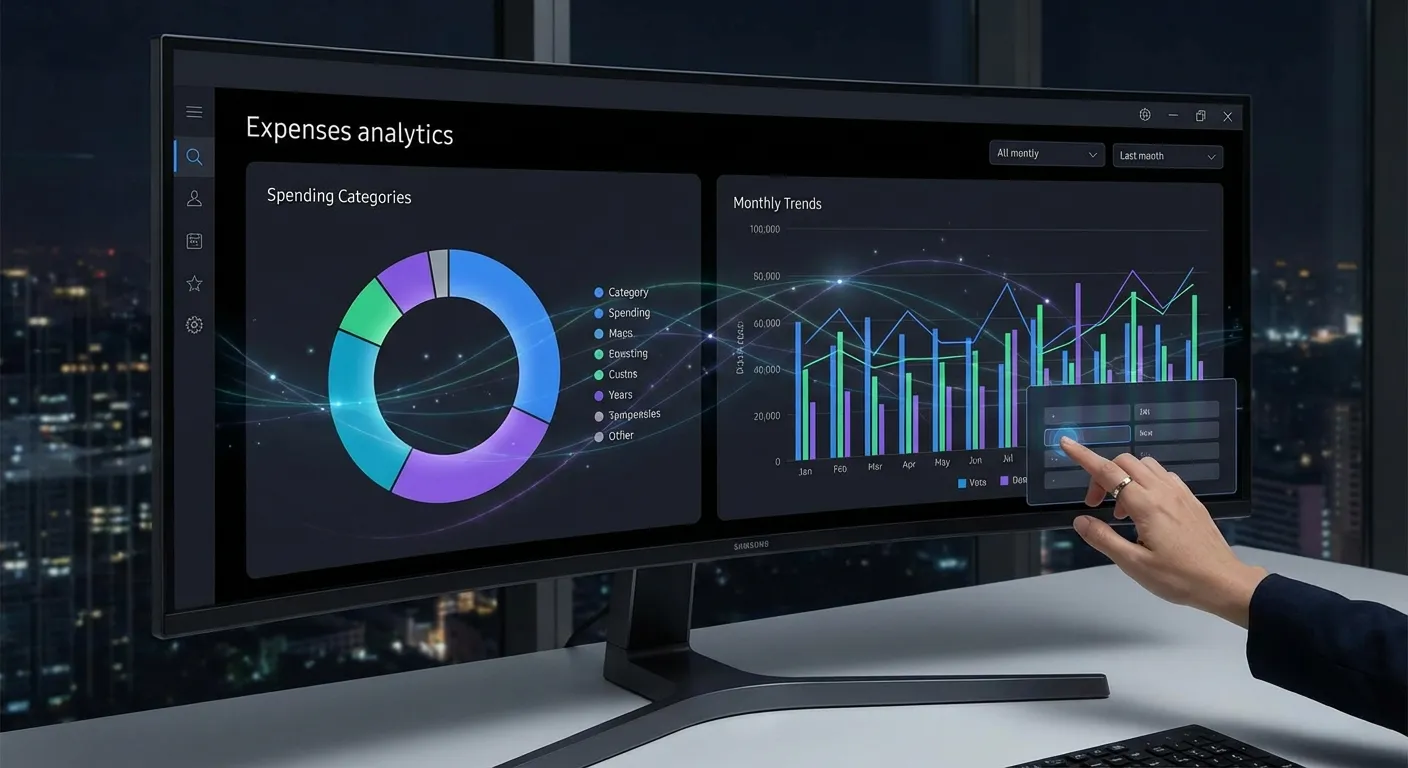
Direct Answer: Portmoneo includes interactive donut charts for categories, dynamic bar graphs for monthly trends, and a “Daily Pulse” view for real-time budget tracking. These intuitive tools offer diverse perspectives for clear financial analysis.
Portmoneo provides advanced, yet easy-to-understand tools designed to bring your financial data to life. Each chart offers a unique perspective, ensuring you have every angle covered for comprehensive expense analysis. This detailed view moves beyond basic summaries to give you a true understanding.
How Do Category Breakdown Charts Reveal Spending Priorities?
Direct Answer: Category charts, like interactive donuts, visually segment your spending. This instantly highlights if areas like “Dining Out” consume more of your budget than expected, allowing for quick prioritization and adjustment.
Our interactive donut charts provide an instant, compelling visual answer to where your money is going. You might be surprised to see “Dining Out” consuming a larger portion of your budget than estimated, perhaps 30% or 40%. Or perhaps “Subscriptions” are quietly adding up. These expense charts make such revelations obvious. Tap any slice to drill down further, exploring the specific transactions that make up that category and gaining granular spending insights.
Can I Track Spending Trends Month-over-Month and Year-over-Year?
Direct Answer: Yes, dynamic bar graphs allow easy tracking of trends over months and years. This helps identify “lifestyle creep,” recognize seasonal patterns, and proactively adjust budgets for long-term stability.
Financial health isn’t about a single month; it’s about understanding progression over time. Our dynamic bar graphs enable you to effortlessly compare your spending month-over-month and even year-over-year. Are you spending more this November than you did last November? Identifying subtle “lifestyle creep” – where spending gradually increases without conscious effort – becomes simple. These spending graphs help you recognize seasonal trends and proactively adjust your budget tracking charts before issues arise. This historical perspective is vital for long-term financial planning.
What is the “Daily Pulse” Feature and How Does it Help Budgeting?
Direct Answer: “Daily Pulse” gives a real-time snapshot of your spending pace. It acts as a proactive indicator, showing if you’re burning through funds too fast. This promotes mindful daily spending, helping you adjust before overspending happens.
Imagine a proactive indicator that tells you if you’re on track with your budget throughout the month. Our “Daily Pulse” view does precisely that, offering a real-time snapshot of your spending pace. This unique personal finance dashboard feature shows if you are burning through your budget too quickly, helping you apply the brakes before you hit zero. It’s a powerful psychological tool that promotes mindful spending and helps you maintain daily control over your cash flow, rather than just reviewing it at month-end.
How Does Portmoneo Turn Data into Actionable Financial Insights?
Direct Answer: Portmoneo highlights actionable areas like top merchants, recurring subscriptions, and budget performance. Instant alerts and irregular expense identification empower users to make informed decisions and optimize their finances.
Portmoneo doesn’t just present beautiful data; we translate it into tangible, actionable insights that drive better financial decisions. Our expense analytics platform helps you not only understand what happened but why it matters and what you can do about it. This focus on practical application sets us apart.
- Top Merchants: Discover exactly who receives the largest share of your money. Seeing “You spent $400 at Starbucks this month” or “$600 at Amazon” can be a powerful motivator. This insight helps you evaluate loyalty, seek alternatives, or simply acknowledge your spending habits with specific vendors. We’ve seen users reduce spending by 15% simply by identifying their top merchant.
- Subscription Tracking: In an age of endless digital services, forgotten subscriptions are silent budget killers. A study by West Monroe found that 70% of consumers underestimate their monthly subscription spending Source: West Monroe. Portmoneo helps you easily spot recurring payments you might have overlooked or no longer need, potentially saving you hundreds of dollars annually by identifying and canceling them.
- Budget vs. Actual: Set simple, realistic limits for different spending categories and watch your progress unfold with visual progress bars. This immediate feedback mechanism provides a clear, motivating picture of how well you’re adhering to your budget, making budget tracking charts intuitive and engaging. When you see a category nearing its limit, you’re prompted to adjust your spending behavior proactively.
- Uncovering Irregular but Significant Expenses: Beyond daily spending, Portmoneo’s analytics can highlight less frequent but high-impact expenses (e.g., car repairs, medical bills). Understanding their timing and frequency helps you better prepare for future occurrences, strengthening your overall financial resilience. This proactive identification is key to avoiding financial surprises.
How Does Portmoneo Ensure Privacy in Expense Analytics?
Direct Answer: Portmoneo processes all analytics entirely on your device. Sensitive data never leaves your phone or enters the cloud. This guarantees your spending habits and insights remain exclusively private.
Portmoneo stands apart with a steadfast commitment to your privacy. Unlike many apps that analyze your financial data to serve targeted ads or sell your information, Portmoneo’s expense analytics run entirely on your device. This fundamental design choice offers superior data protection.
- No Cloud Processing: Your sensitive financial information never leaves your phone. Your device’s processor crunches all the numbers, ensuring maximum security and data sovereignty. This method eliminates the risk of cloud breaches.
- Private Insights: Your financial habits, patterns, and spending insights remain exclusively yours. There is no server to hack, no third party to share with. This privacy-first approach gives you complete peace of mind, knowing your most personal data is truly private.
- Learn more about our privacy-first architecture and how we protect your financial world.
Who Can Benefit Most from Portmoneo’s Expense Analytics?
Direct Answer: Anyone seeking financial clarity benefits, including budgeters, visual learners, families, and freelancers. It’s ideal for those wanting an intuitive, actionable view of their finances without manual guesswork.
Portmoneo’s intuitive and powerful expense analytics are designed for anyone seeking greater control and clarity over their money. We’ve seen our tool empower a diverse range of users to better manage their finances.
- Budgeters: Individuals who want to diligently stick to financial limits but find complex spreadsheets daunting. Portmoneo offers a simpler, more visual path to successful budgeting.
- Visual Learners: Individuals who find endless rows of numbers overwhelming will appreciate how Portmoneo transforms complex data into easily digestible expense charts and spending graphs.
- Families: Households that need transparent, shared insights into where the collective budget is going, fostering better financial communication and joint decision-making.
- Freelancers & Small Business Owners: Professionals who need to meticulously analyze business expenses versus income for tax purposes, profitability assessment, and strategic financial planning.
- Anyone Seeking Financial Clarity: If you’re tired of guessing where your money went and want a clear, actionable picture of your financial life, Portmoneo provides the tools you need.
Frequently Asked Questions (FAQ)
Can I export these charts or the underlying data?
Currently, you can easily export the raw underlying transaction data to Excel or CSV formats for custom reports or further analysis. We are actively developing functionality to export the visually appealing charts and graphs directly into PDF format for easier sharing and presentation in the near future.
You can already export your raw data to Excel or CSV. This allows you to create custom reports, conduct further in-depth analysis, or share data with an accountant. We are actively working on functionality to export the visually appealing charts and graphs directly into PDF format for easier sharing and presentation.
Does Portmoneo’s analytics work with cash expenses?
Absolutely! Our comprehensive analytics engine includes all transactions, regardless of their origin. Whether expenses are added via AI Receipt Scanning, manually entered through the app, or quickly logged using voice input, every expense contributes to your overall financial picture and is reflected in your expense analytics dashboard.
Our comprehensive analytics engine includes all transactions, regardless of their origin. Whether they were added via AI Receipt Scanning, manually entered through the app, or quickly logged using voice input, every expense contributes to your overall financial picture and is reflected in your expense analytics dashboard.
Is it complicated to set up or trigger the analytics dashboard?
Not at all. Portmoneo is designed for simplicity and ease of use. The analytics dashboard updates automatically and dynamically every time you add a new expense. There is no complex configuration, manual syncing, or special action required on your part. Your personal finance dashboard is always up-to-date, providing instant insights whenever you open the app.
Portmoneo is designed for simplicity and ease of use. The analytics dashboard updates automatically and dynamically every time you add a new expense. There is no complex configuration, manual syncing, or special action required on your part. Your personal finance dashboard is always up-to-date, providing instant insights whenever you open the app.
How does Portmoneo categorize my transactions?
Portmoneo utilizes smart categorization tools to automatically assign transactions to relevant spending categories based on merchant data and your past habits. You can also easily edit, refine, or create custom categories to ensure your analytics perfectly reflect your unique financial structure and priorities.
Portmoneo uses smart categorization to automatically assign transactions. It learns from your input, making the process more accurate over time. You can always edit categories for specific transactions or create entirely new, custom categories to personalize your financial overview.
Can I set and track budgets for specific categories?
Yes, Portmoneo allows you to set clear, realistic budget limits for any spending category. Our visual progress bars and “Daily Pulse” feature provide immediate feedback, showing you exactly how well you’re adhering to your budgets in real-time and prompting proactive adjustments.
You can set clear, realistic budget limits for any spending category within Portmoneo. Our visual progress bars and the “Daily Pulse” feature provide immediate feedback. This shows you exactly how well you’re adhering to your budgets, allowing for proactive adjustments before overspending occurs.
What makes Portmoneo’s analytics different from my bank’s app?
Portmoneo offers deeper, more customizable, and private analytics compared to most bank apps. While banks provide basic summaries, Portmoneo focuses on comprehensive visualization, actionable insights like subscription tracking, and strict on-device data processing, ensuring your financial habits remain truly private and under your control.
Most bank apps offer basic summaries. Portmoneo, however, provides deeper, more customizable, and privacy-focused analytics. Our platform focuses on comprehensive visualization, unique actionable insights like detailed subscription tracking, and strict on-device data processing. This ensures your financial habits remain truly private and entirely under your control, offering a superior level of financial clarity and security.